When developing applications, especially games, it is important to optimize the code as much as possible so that the performance is stable. To see how well your application is performing, there are two main important things to look at - the frame rate and the memory usage.
OpenFL offers a class called FPS for displaying the frame rate to the developer, however, there's no option to display memory usage.
In this tutorial I'll show you how to write a class that will display both of these statistics.
The frame rate displays how many frames are rendered per second. In OpenFL projects the default FPS is set in applications.xml and the value is 60 by default. If there's a lot of code being processed and your CPU can't keep up, your app slows down (i.e. your frame rate decreases).
Memory management is also very important. When any program is executed, it is loaded into RAM. The size of the allocated memory is determined dynamically. The more objects you create, the more references and variables you declare - the more memory is taken by the program. When an object is deleted or all references to an object have been deleted, it is eventually removed from memory completely by an internal garbage collector.
When you see the current memory usage of your app, it is easy to tell when you create unwanted memory leaks. A memory leak is when unused objects are constantly added to the memory, but are not removed by the garbage collector, because they were not deleted correctly by the developer.
When you see your memory constantly increasing with every frame - that means you messed up. Leave the program on for too long and it will exhaust a lot of system memory. Not nice!
There are many approaches to detecting memory leaks. You can use breakpoints or simply comment pieces of code and see if that contributed anything to the memory usage. When the faulty code is found, you need to take a closer look at it and determine what objects are not being deleted properly.
As I already said, there's a built-in FPS display in OpenFL. Adding it is simple:
var fps:FPS = new FPS(10, 100, 0xffffff);

addChild(fps);
Since there's no class that displays memory usage, I wrote one that displays both the FPS and memory. The class is based on the FPS class provided by OpenFL, except that I couldn't extend it, since one of the crucial functions is marked as private and inaccessible for subclasses.
I called the class FPS_Mem and put it in com.kircode.debug package. Here's the code:
package com.kircode.debug;
import haxe.Timer;
import openfl.display.FPS;
import openfl.events.Event;
import openfl.system.System;
import openfl.text.TextField;
import openfl.text.TextFormat;
/**
* FPS class extension to display memory usage.
* @author Kirill Poletaev
*/
class FPS_Mem extends TextField
{
private var times:Array<Float>;
private var memPeak:Float = 0;
public function new(inX:Float = 10.0, inY:Float = 10.0, inCol:Int = 0x000000)
{
super();
x = inX;
y = inY;
selectable = false;
defaultTextFormat = new TextFormat("_sans", 12, inCol);
text = "FPS: ";
times = [];
addEventListener(Event.ENTER_FRAME, onEnter);
width = 150;
height = 70;
}
private function onEnter(_)
{
var now = Timer.stamp();
times.push(now);
while (times[0] < now - 1)
times.shift();
var mem:Float = Math.round(System.totalMemory / 1024 / 1024 * 100)/100;
if (mem > memPeak) memPeak = mem;
if (visible)
{
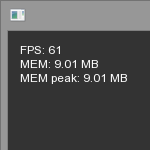
text = "FPS: " + times.length + "\nMEM: " + mem + " MB\nMEM peak: " + memPeak + " MB";
}
}
}The usage is similar to FPS.
var fps_mem:FPS_Mem = new FPS_Mem(10, 10, 0xffffff);

addChild(fps_mem);
In a nutshell, the class adds an ENTER_FRAME listener to itself and updates the text field with values every frame. The memory is calculated using basic math.
The FPS is not really calculated, instead the program counts how many times the frame was shown during the last second and displays that value.
The memory peak displays the maximum memory usage that happened during that session.
If you found this helpful, you might want to check out my other articles and subscribe to the free newsletter.